A GOOD SYSTEM NEVER FAILS IT FAILS ONLY BECAUSE IT IS USED AT A WRONG TIME.http://forex-strategies-revealed.com/advanced/system-selection-techniqueเป็นบทความที่ดี คะ กล่าวถึง เมื่อไหร่ ควร ใช้ดัชนี ตัวใดในการ วัดการแกว่ง
ไอซี่ ทำสคริปไว้ สำหรับตัวนี้ ใครสนใจ บอก อีเมล์ มาที่ข้อความส่วนตัว นะคะ
ตัวอย่างคะ
This is not a trading strategy but a technique to determine which system to use and when. There are many systems available to use some are trend following systems like moving average crossover and some are oscillator based system which utilize indicators such as Stochastic, Rsi and William %R but if all these systems are good then why they work sometimes and sometimes they fail?
The reason is selection of a good system at wrong time.
We can overcome this problem with the use of one simple indicator ADX(14)
The level of ADX can help us to decide which system to use at a given point of time.
Now let me explain you how to accomplish this goal.
PLOT
ADX(14) ON CHART FOR YOUR CURRENCY PAIR.
IF...
1)ADX is below 20 - USE OSCILLATOR BASED SYSTEM
(RSI,STOCHASTIC ETC.)2)ADX is above 30 - USE TREND FOLLOWING SYSTEM
(MOVING AVERAGE,MACD ETC.)3)ADX is at 45 or above it -
BOOK PROFITS.(Wait for new entry)4)ADX IS RISING FROM LEVEL BELOW 18 AND THEN GOING ABOVE 23 -
USE TREND FOLLOWING SYSTEM.5)ADX DECLINING FROM LEVEL ABOVE 30 AND THEN GOING BELOW 27 -
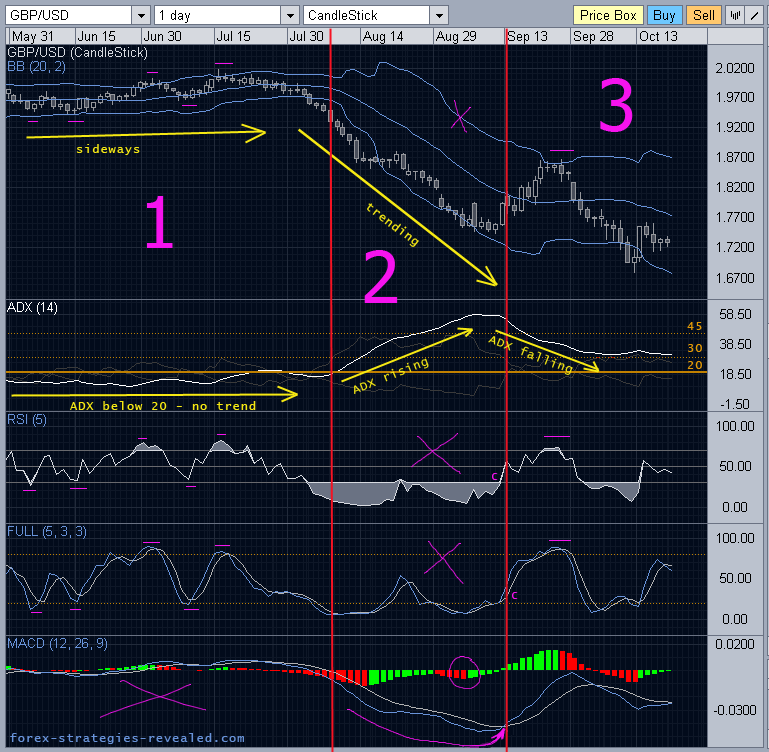
USE OSCILLATOR BASED SYSTEM. http://forex-strategies-revealed.com/files/pictures_strategies/system_selection.png
There are 3 blocks:
1. The market is moving sideways
2. The market is trending
3. The trend is weakening, re-evaluation of forces begins
Block #1:
The market is moving sideways.
We can simply see it, but also we can get clues from ADX indicator, which now stays below 20.
Signals of which indicators should use for trading in this conditions? We use everything but trend indicators:
- Bolliger bands - the price will bounce off BB levels.
- RSI - react to oversold/overbought zones
- Stochastic - Stoch crosses, especially those in oversold/overbought zones.
As you can see in Block #1, they all give true signals.
Unlike MACD, which is revolves around zero line, crossing back and forth. It is useless.
Also Moving averages (which I didn't put on the chart, it is too messy already

, they also will give false signals, and thus should be ignored.
Block #2:
The market is trending, which is confirmed by ADX, it moved past 20 and is rising.
What indicators and systems to use? Use trend following indicators obviously:
- MACD is good.
- Moving averages would be good.
Unlike now RSI and Stochastic - they will remain in oversold /bought zones (depending on a trend) for a long time.
Unlike also Bollinger bands - the price won't obey its boundaries anymore.
Now, ADX reaches 45 - it is time to think about collecting or protecting profits. The trend is mature. We look for the clues from our trending indicators. In this case the earliest signal is received from MACD histogram (circled in purple), which changes color from red to green. Later confirmation for those who missed, comes from MACD lines crossover; and even Stochastic and RSI finally come out from oversold zones (small letter "c" - confirmation - on the chart).
When traders are out the trend begins to weaken, ADX starts to fall, price retraces upwards.
Block #3:
- ADX is falling, which means the trend has gone, at least temporarily.
We don't know whether it is going to continue or not, so we seek advice from indicators, but not a single one - a group of them.
ADX in this case becomes useless until it begins to rise again.
Why? While ADX is falling two things may happen: first - the trend will take a break - ADX will continue to fall; second - the new trend (uptrend in our case) may begin sharply - ADX will also continue falling only confirming that a downtrend is weakening yet more. (During sharp turns in the trend ADX is late with a responce, a recognition of new trend. During slow turns it is accurate.)
So, whether a new uptrend begins sharply or an old downtrend weakens, ADX will show the same tendency - it will fall suggesting no clear trend... That's why we don't use ADX when it is falling.
So, later in block #3 we get a strong Sell signal from all 4 indicators:
- price meets BB and retreats,
- RSI overbought,
- Stochastic overbought,
- MACD histogram has changes from bullish to bearish.
That's a signal to Short.
