Forex-Currency Trading-Swiss based forex related website. Home ----- กระดานสนทนาหน้าแรก ----- Gold Chart,Silver,Copper,Oil Chart ----- gold-trend-price-prediction ----- ติดต่อเรา
หน้า: 1 ... 3 4 [5] 6   ลงล่าง
พิมพ์
ผู้เขียน หัวข้อ: ค้นฟ้า หาดาว - Gap Trading  (อ่าน 22677 ครั้ง)
0 สมาชิก และ 2 บุคคลทั่วไป กำลังดูหัวข้อนี้
Pocky
บุคคลทั่วไป
« ตอบ #60 เมื่อ: มีนาคม 22, 2010, 09:13:52 AM »

 Smiley ขอบคุณมากค่ะน้องไอซ์   Smiley
บันทึกการเข้า
Pocky
บุคคลทั่วไป
« ตอบ #61 เมื่อ: มีนาคม 25, 2010, 12:48:03 AM »

<a href="http://glitter.kapook.com/category.php?category_id=112&sid=46369509c26493c1fab6db6f3fb07734" target="_blank"><img src="http://s242.photobucket.com/albums/ff298/akapong999/glitter2/glitterThai/T250909_06C.gif" border="0" alt="คลิกๆๆ รูปสวยๆน่ารักๆไว้ส่งต่อเพียบ..." title="คลิกๆๆ รูปสวยๆน่ารักๆไว้ส่งต่อเพียบ...">[/url]

มาขอบคุณค่ะ
บันทึกการเข้า
newa
Hero Member
****
ออฟไลน์ ออฟไลน์

กระทู้: 1392


« ตอบ #62 เมื่อ: มีนาคม 25, 2010, 08:19:16 AM »

         Grin อรุณสวัสดิ์ค่ะ  ขอบคุณมาก ๆ ค่ะ    Grin

               
บันทึกการเข้า
Icy
Moderator
Hero Member
*****
ออฟไลน์ ออฟไลน์

กระทู้: 1188


« ตอบ #63 เมื่อ: มีนาคม 27, 2010, 06:15:43 PM »

There's a kiss at the end of rainbow

ลองเข้าไปโหลด อินดี้ และ คู่มือนะคะ ตามลิ้งคะ
http://forex-strategies-revealed.com/scalping/trend-trades


บันทึกการเข้า

ข้อเขียนทั้งหมด เป็นเพียงมุมมองส่วนตัว เพื่อแลกเปลี่ยนความคิดเห็นเท่านั้น

Icy
Moderator
Hero Member
*****
ออฟไลน์ ออฟไลน์

กระทู้: 1188


« ตอบ #64 เมื่อ: มีนาคม 27, 2010, 10:27:57 PM »

2 SARs to go
http://forex-strategies-revealed.com/system-2sarstogo

Trade the most active hours – London and New York.
EUR/USD 5 min
GBP/USD 5 min
(optionally may also trade AUD/USD)
SAR (0.01, 0.1) – on the chart
SMA 8 – on the chart
MACD (5, 8, 9) + SAR (0.01, 0.1) on this MACD


Trading Rules:
When we talk about “trend change” we mean small tiny trends that are actual for us scalpers on 5 minute chart. We do not want to know what is going on 15 min, hourly or even more so daily chart.

With the first SAR dot appearing on the opposite side (the trend has changed) – open one “trial” position Stop loss -12 (spread not included), Take profit +5. Once profit target has been hit – look for the best that current price can offer and open three equal orders. Stop loss for all orders is -12 pips (without spread), profits will be taken next way:

1st order – close in 5 pips and later constant re-entry-scalping with rules described below.
2nd order – close on 14th (or 18th) SAR dot (whichever SAR got first 14 dots – just count them) – this gives us some relief that we have scored something. Also you may not wait till certain number of dots and just close second order where you fill it is a good gain to secure.
Another option: if you are familiar with waves and know what price retracement means, look to close 2nd order after the first, at most second clearly noticeble retracement and once the price has recovered and gave a strong move forward.
3rd – this order remains open and it is our constant relief that we are always earning something as long as both SARs are in agreement that the trend is alive. We close 3rd order only with the first SAR dot (any of 2 SARs) appearing on the opposite side signaling of a reversal.

บันทึกการเข้า

ข้อเขียนทั้งหมด เป็นเพียงมุมมองส่วนตัว เพื่อแลกเปลี่ยนความคิดเห็นเท่านั้น

Icy
Moderator
Hero Member
*****
ออฟไลน์ ออฟไลน์

กระทู้: 1188


« ตอบ #65 เมื่อ: มีนาคม 28, 2010, 09:49:41 AM »

A GOOD SYSTEM NEVER FAILS IT FAILS ONLY BECAUSE IT IS USED AT A WRONG TIME.
http://forex-strategies-revealed.com/advanced/system-selection-technique

เป็นบทความที่ดี คะ กล่าวถึง เมื่อไหร่ ควร ใช้ดัชนี ตัวใดในการ วัดการแกว่ง ไอซี่ ทำสคริปไว้ สำหรับตัวนี้ ใครสนใจ บอก อีเมล์ มาที่ข้อความส่วนตัว นะคะ

ตัวอย่างคะ

This is not a trading strategy but a technique to determine which system to use and when. There are many systems available to use some are trend following systems like moving average crossover and some are oscillator based system which utilize indicators such as Stochastic, Rsi and William %R but if all these systems are good then why they work sometimes and sometimes they fail?

The reason is selection of a good system at wrong time.

We can overcome this problem with the use of one simple indicator ADX(14)

The level of ADX can help us to decide which system to use at a given point of time.
Now let me explain you how to accomplish this goal.

PLOT ADX(14) ON CHART FOR YOUR CURRENCY PAIR.
IF...
1)ADX is below 20 - USE OSCILLATOR BASED SYSTEM (RSI,STOCHASTIC ETC.)
2)ADX is above 30 - USE TREND FOLLOWING SYSTEM (MOVING AVERAGE,MACD ETC.)

3)ADX is at 45 or above it - BOOK PROFITS.(Wait for new entry)

4)ADX IS RISING FROM LEVEL BELOW 18 AND THEN GOING ABOVE 23 - USE TREND FOLLOWING SYSTEM.
5)ADX DECLINING FROM LEVEL ABOVE 30 AND THEN GOING BELOW 27 - USE OSCILLATOR BASED SYSTEM.
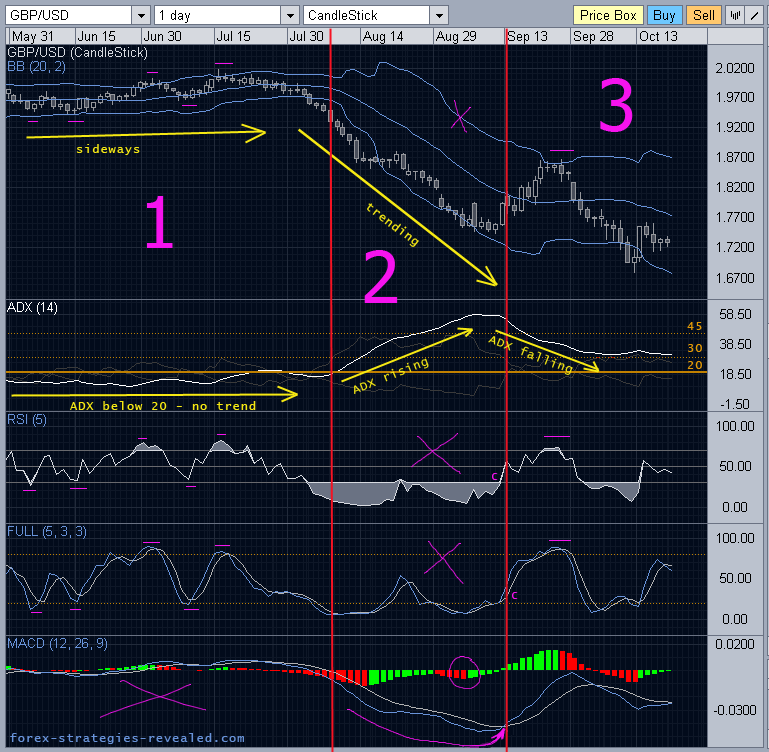

http://forex-strategies-revealed.com/files/pictures_strategies/system_selection.png

There are 3 blocks:
1. The market is moving sideways
2. The market is trending
3. The trend is weakening, re-evaluation of forces begins

Block #1:

The market is moving sideways.
We can simply see it, but also we can get clues from ADX indicator, which now stays below 20.
Signals of which indicators should use for trading in this conditions? We use everything but trend indicators:
- Bolliger bands - the price will bounce off BB levels.
- RSI - react to oversold/overbought zones
- Stochastic - Stoch crosses, especially those in oversold/overbought zones.
As you can see in Block #1, they all give true signals.
Unlike MACD, which is revolves around zero line, crossing back and forth. It is useless.
Also Moving averages (which I didn't put on the chart, it is too messy already Smiley, they also will give false signals, and thus should be ignored.

Block #2:

The market is trending, which is confirmed by ADX, it moved past 20 and is rising.
What indicators and systems to use? Use trend following indicators obviously:
- MACD is good.
- Moving averages would be good.
Unlike now RSI and Stochastic - they will remain in oversold /bought zones (depending on a trend) for a long time.
Unlike also Bollinger bands - the price won't obey its boundaries anymore.

Now, ADX reaches 45 - it is time to think about collecting or protecting profits. The trend is mature. We look for the clues from our trending indicators. In this case the earliest signal is received from MACD histogram (circled in purple), which changes color from red to green. Later confirmation for those who missed, comes from MACD lines crossover; and even Stochastic and RSI finally come out from oversold zones (small letter "c" - confirmation - on the chart).
When traders are out the trend begins to weaken, ADX starts to fall, price retraces upwards.

Block #3:

- ADX is falling, which means the trend has gone, at least temporarily.
We don't know whether it is going to continue or not, so we seek advice from indicators, but not a single one - a group of them.

ADX in this case becomes useless until it begins to rise again.
Why? While ADX is falling two things may happen: first - the trend will take a break - ADX will continue to fall; second - the new trend (uptrend in our case) may begin sharply - ADX will also continue falling only confirming that a downtrend is weakening yet more. (During sharp turns in the trend ADX is late with a responce, a recognition of new trend. During slow turns it is accurate.)
So, whether a new uptrend begins sharply or an old downtrend weakens, ADX will show the same tendency - it will fall suggesting no clear trend... That's why we don't use ADX when it is falling.

So, later in block #3 we get a strong Sell signal from all 4 indicators:
- price meets BB and retreats,
- RSI overbought,
- Stochastic overbought,
- MACD histogram has changes from bullish to bearish.
That's a signal to Short.

« แก้ไขครั้งสุดท้าย: มีนาคม 28, 2010, 09:33:33 PM โดย Icy » บันทึกการเข้า

ข้อเขียนทั้งหมด เป็นเพียงมุมมองส่วนตัว เพื่อแลกเปลี่ยนความคิดเห็นเท่านั้น

aon-87
Jr. Member
**
ออฟไลน์ ออฟไลน์

เพศ: ชาย
กระทู้: 228


« ตอบ #66 เมื่อ: เมษายน 09, 2010, 09:41:19 PM »

Cool สวัสดีปีใหม่ครับอาจารย์ไอซ์ที่น่ารักของทุกคน ปู่จะไม่มีวันลืมคนเก่ง คยขยัน ใจดีคนนี้ตลอดไปครับ

ฝากบอกเพื่อนๆชาวออนเอ็มด้วยครับว่าถ้าโน้ตบุ๊คซ่อมเสร็จจะแว๊ปเข้าไปเม้าท์กันเหมือนเดิม

โดยเฉพาะนู๋ อีที นู๋วีทูบี ขาช้อตผมชี้ทั้งหลาย อิ อิ Grin Grin Grin Cool

 Cool สวัสดีครับจานไอซ์ที่น่ารัก คิดถึงมากมายครับ รักษาสุขภาพนะครับ รอช้อต รอช้อต อิ อิ Grin
บันทึกการเข้า
Icy
Moderator
Hero Member
*****
ออฟไลน์ ออฟไลน์

กระทู้: 1188


« ตอบ #67 เมื่อ: เมษายน 11, 2010, 01:07:07 AM »


A type of candlestick chart that shares many characteristics with standard candlestick charts, but differs because of the values used to create each bar. Instead of using the open-high-low-close (OHLC) bars like standard candlestick charts, the Heikin-Ashi technique uses a modified formula:

Close = (Open+High+Low+Close)/4
Open = [Open (previous bar) + Close (previous bar)]/2
High = Max (High,Open,Close)
Low = Min (Low,Open, Close)

Investopedia Says:
The Heikin-Ashi technique is used by technical traders to identify a given trend more easily. Hollow candles with no lower shadows are used to signal a strong uptrend, while filled candles with no higher shadow are used to identify a strong downtrend.


Positive candles (blue) containing no wicks: There is strong uptrend momentum in the session and it will likely continue. Here, the trader will have a hands-off approach to profits while strongly considering adding on to the position.
Positive candles (blue) containing shadows or wicks: Strength continues to support the price action higher. At this point, with upside potential still present, the investor will likely consider the notion of adding to the overall position.   
A smaller candle body with longer wicks: Similar to the doji candlestick formation, this candle suggests a near-term turnaround in the overall trend. Signaling indecision, market participants are likely to wait for further directional bias before pushing the market one way or the other. Traders following on the signal will likely prefer confirmation before initiating any positions.
Negative candles (red) containing shadows or wicks: Weakness or negative momentum is supporting the price action lower in the market. As a result, traders will want to begin exiting initial long positions or selling positions at this point.
Negative candles (red) containing no shadows or wicks: Selling momentum is strong and will likely support a move lower in the overall decline. As a result, the trader would do well to add to existing short holdings.


บันทึกการเข้า

ข้อเขียนทั้งหมด เป็นเพียงมุมมองส่วนตัว เพื่อแลกเปลี่ยนความคิดเห็นเท่านั้น

Icy
Moderator
Hero Member
*****
ออฟไลน์ ออฟไลน์

กระทู้: 1188


« ตอบ #68 เมื่อ: เมษายน 18, 2010, 06:44:36 PM »


http://www.fxfriend.com//?cid=493387
บันทึกการเข้า

ข้อเขียนทั้งหมด เป็นเพียงมุมมองส่วนตัว เพื่อแลกเปลี่ยนความคิดเห็นเท่านั้น

dada
Newbie
*
ออฟไลน์ ออฟไลน์

กระทู้: 140


« ตอบ #69 เมื่อ: พฤษภาคม 23, 2010, 01:43:17 PM »

 
Re: ค้นฟ้า หาดาว - Gap Trading
« ตอบ #70 เมื่อ: วันนี้ เวลา 03:21:14 PM »   
________________________________________
วิธีเทรด แบบ 1-2-3
http://www.tradejuice.com/forex/forex-1-2-3-methode-mm.htm


เทคนิค เฉพาะตัวนี้ มีกันมานานแล้ว และผู้เขียนเห็นครั้งแรกในตลาดฟิวเจอร์ส ตั้งแต่ผู้เขียน ได้เห็นนักเทรด หลายคนใช้เทคนิคนี้ ในเกือบทุกๆ ตลาด และ ใช้เทรดได้เป็นอย่างดี และ ให้ประสิทธิผลอันน่าทึ่ง

เรามาเริ่มดู แนวคิดพื้นฐาน - ระหว่างช่วงแนวโน้ม ที่มี ทั้งขึ้นและ ลง ตลาดจะสร้าง จุดสูงสุดเล็กๆ และ เนินเขา - ดูรูปประกอบด้านล่าง


ปัญหา คือ ท่านจะทราบได้อย่างไร ว่า เมื่อไหร่ จะเข้าตลาด และ เมื่อไหร่ จะเดินออกจากตลาด และ นี่คือ ที่มา ของ วิธีการเทรดแบบ 1-2-3  เราลองมาดู รูปแบบพื้นฐานกันก่อน


ดูดีและง่านย แต่ ก้อยังคง ไม่ได้บอก อะไรเรา ว่าควรจะเข้าเทรด หรือ ไม่  - ดังนั้น เรา จะต้อง หา อินดิเคเตอร์ มาช่วย ซึ่ง ท่านสามารถเลือกใช้ อินดิเคเตอร์ ตัวไหน ก้อได้ กับ วิธีการนี้ ซึ่งสำหรับ ผู้เขียนชอบที่จะใช้ MACD 12 26 9 มากกว่า - ดังนั้น เราจะได้ ตามรูป ด้านล่าง


คราวนี้ เราเจอจุด ที่น่าสนใจแล้ว  มาดู กฏการเทรด ดังต่อไปนี้

เทรนขาขึ้น
•   เทคนิคนี้ ใช้ได้ดี กับ จุดกลับตัว ดังนั้น หาขาลงก่อนหน้านี้ ให้เจอก่อน
•   รอ MACD ให้เกิดสัญญานซื้อก่อน และ ใช้หลัก 1-2-3 เข้าไป
•   ในขณะที่ ตลาด มีการ ย่อตัว ที่จุด 3 MACD ควรจะ ยังคงอยู่ใน ช่วงขาขึ้น หรือ อาจมีการหักลงเล็กน้อย ดูเหมือนสัญญานขาย
•   ให้เข้าซื้อ 1 ลอท ที่จุด ย่อตัว 2
•   และตั้งตัดขาดทุน ต่ำกว่าจุด 3
•   วัดระยะระหว่าง จุด 2 และ 3 และ วางแนวไปหาจุดที่จะตัด กำไร
•   จุด 2 ควรจะอยู่ไม่ต่ำกว่า จุด 1 

การ กลับตัวนี้ เป็นจริง สำหรับการเทรด ระยะสั้น ขณะที่ ตลาด กำลัง วิ่งขึ้นไป หรือ กำไรคุณกำลังเพิ่มขึ้น คุณสามารถตั้ง การตัด ขาดทุนกำไร (trailing stop) ให้มากกว่า ฐานเนิน ระหว่างการย่อตัว

ตัวอย่างเพิ่มเติม


มี หลายรูปแบบที่อาจแตกต่างกันไป ในการตั้งหลัก 1-2-3 แต่ แนวคิดพื้นฐานจะยังเหมือนเดิมเสมอ


----------------------------------------------------------------------------------

จาก การเทรด ฟิวเจอร์ส มีหลายท่านประสบความสำเร็จ และ หลายท่านสูญเสียอย่างมากมาย จึงอยากมาคุยแลกเปลี่ยนความคิดเห็น สำหรับการเทรด ฟิวเจอร์ส ที่ลดความเสี่ยงมากที่สุด
•   เวลา - กำหนดระยะเวลาเข้าออก ให้ เหมาะสมก่อน โดยเลือก อินดี้ที่คุณถนัด ในการกำหนด ระยะเวลา - ไม่ใช่ การกำหนดราคา
•   สัดส่วนลงทุน - อย่าลงทุน เกินกว่า 20% ของพอร์ทเด็ดขาด ถ้าคุณสายป่านไม่ยาวเพียงพอ คุณ อาจไม่มีกำลัง พอสู้ กับตลาดนี้ได้
•   การตัดขาดทุน หรือ การเข้าลอค - เมือพลาดท่า ผิดทาง หรือ คุณกำลังเดินสวนกับ อินดี้ ที่คุณ ใช้อยู่ ไม่ต้องคิดมาก ตัดขาดทุน(หากยังน้อยอยู่) หรือ เข้าลอค(หากมัน มาไกลไปแล้ว) แล้วรอ การปลดลอค เมื่อ อินดี้ของคุณ บอกสัญญาน
•   การตัดกำไร - อย่าโลภ และ อย่าเลือก จุดสูงสุด ต่ำสุดเด็ดขาด เพราะจุดต่ำสุดสูงสุด ไม่ได้ถูกกำหนด ด้วยดีมานด์ แต่ ถูกหนด ด้วย โปรแกรมกวาดพอร์ทของรายใหญ่ ทีใช้การแสกนหา จุดตั้งตัดขาดทุนของนักเทรดออนไลน์ - ให้เลือก ระยะเวลาเป็นหลัก ในการตัดกำไร


ถ้า คุณ รู้จัก ตัวเอง และ เงื่อนเวลา  คุณจะสามารถลดความเสี่ยง ได้มากขึ้น นะคะ

(หวังว่า คน ที่ พลาด โอกาส จะได้สามารถ เข้ามาอ่าน บทความนี้ กัน นะคะ เพื่อ อย่างน้อยลดความเสี่ยงลง และ ค่อยๆ ทำเงินกลับมา)

« แก้ไขครั้งสุดท้าย: วันนี้ เวลา 03:24:47 PM โดย Icy »    
บันทึกการเข้า

คนร้ายในคราบนักบุญ  น่าสะพึงกลัวกว่าสิ่งใด
dada
Newbie
*
ออฟไลน์ ออฟไลน์

กระทู้: 140


« ตอบ #70 เมื่อ: พฤษภาคม 23, 2010, 09:57:25 PM »

Icy
Hero Member
   
 ออฟไลน์

กระทู้: 1010
 
   
Re: ค้นฟ้า หาดาว - Gap Trading
« ตอบ #69 เมื่อ: วันนี้ เวลา 02:35:34 PM »   
________________________________________
Forex 1-2-3 Method by Mark Mc Rae
http://www.tradejuice.com/forex/forex-1-2-3-methode-mm.htm

This particular technique has been around for a long time and I first saw it used in the futures market.

Since then I have seen traders using it on just about every market and when applied well, can give amazingly accurate entry levels.

Lets first start with the basic concept. During the course of any trend, either up or down, the market will form little peaks and valleys. see the chart below:


The problem is, how do you know when to enter the market and where do you get out. This is where the 1-2-3 method comes in. First let's look at a typical 1-2-3 set up:


Nice and simple, but it still doesn't tell us if we should take the trade. For this we add an indictor. You could use just about any indictor with this method but my preferred indictor is MACD with the standard settings of 12,26,9. With the indictor added, it now looks like this:


Now here is where it gets interesting. The rules for the trade are as follows:

Uptrend
•   This works best as a reversal pattern so identify a previous downtrend.
•   Wait for the MACD to signal a buy and for the 1-2-3 set up to
be in place.
•   As the market pulls back to point 3, the MACD should remain in
buy mode or just slightly dip into sell.
•   Place a buy entry order 1 pip above point 2
•   Place a stop loss order 1 pip below point 3
•   Measure the distance between point 2 and 3 and project that
forward for your exit.
•   Point 2, should not be lower than point 1 


The reverse is true for short trades. As the market progresses you can trail your stop to 1 pip below the most recent low (Valley in an uptrend). You can also use a break in a trend line as an exit.

Some examples:


There are a lot of variations on the 1-2-3 setup but the basic concept is always the same. Try experimenting with it on your favorite time frame.

บันทึกการเข้า

คนร้ายในคราบนักบุญ  น่าสะพึงกลัวกว่าสิ่งใด
Icy
Moderator
Hero Member
*****
ออฟไลน์ ออฟไลน์

กระทู้: 1188


« ตอบ #71 เมื่อ: พฤษภาคม 23, 2010, 09:57:46 PM »

SFT Camarilla Equation Levels
http://tradinglib.com/indicators/camarilla-equation

Camarilla Formula
The equation can be found on some forums, reproduced here:


HL5 = (hi/lo)*close

HL4 = ( ((hi/lo)+0.83)/1.83 ) *close

HL3 = ( ((hi/lo)+2.66)/3.66 ) *close

LL5 = close - (HL5-close)

LL4 = close - (HL4-close)

LL3 = close - (HL3-close)


Be careful this equation is not entirely perfect, the L3 is often too low, so keep it in consideration.


The SFT Camarilla Equation produces 8 levels from yesterday’s open, high, low and close.

These levels are split into two groups, numbered 1 to 4.

The pattern formed by the 8 levels is broadly symmetrical,
and the most important levels are the ‘L3′, ‘L4′ and ‘H3′, ‘H4′ levels.

While day trading, traders look for the market to reverse if it hits an ‘L3′ or ‘H3′ level.

They would then open a position AGAINST the trend, using a stop loss somewhere before the associated ‘L4′ or ‘H4′ level.

The SFT theory suggests setting stoplosses that appear to you the trader to be prudent,

and to not even open the trade until it has penetrated the level in the ‘right’ direction,

 i.e. demonstrated that it has found resistance (or support). In the case of the higher H3 level, this would mean that price had already reversed and pushed back down thru the level, heading south.

The second way

to try day trading with the Camarilla Equation is to regard the ‘H4′ and ‘L4′ levels as ‘breakout’ levels –
 
in other words to go WITH the trend if prices push thru either the H4 or L4 level. This essentially covers all the bases – Day Trading within the H3 and L3 levels enables you to capture all the wrinkles that intraday market movement throws up, and the H4 – L4 breakout plays allow the less experienced trader to capitalise on relatively low risk sharp powerful movements. Here’s what it looks like in action:


Anyway, the lines are really accurate, but what isn't very easy is understand when the price is wanting to bounce and when it is wanting to pass through.  It's a bit of guessing. If you trade the range inside, if you wait too long to enter then the SL becomes too big compared to the TP, if you enter too fast you might be on the wrong side.

« แก้ไขครั้งสุดท้าย: พฤษภาคม 24, 2010, 02:17:16 AM โดย Icy » บันทึกการเข้า

ข้อเขียนทั้งหมด เป็นเพียงมุมมองส่วนตัว เพื่อแลกเปลี่ยนความคิดเห็นเท่านั้น

dada
Newbie
*
ออฟไลน์ ออฟไลน์

กระทู้: 140


« ตอบ #72 เมื่อ: พฤษภาคม 23, 2010, 10:00:05 PM »

 
Re: ค้นฟ้า หาดาว - Gap Trading
« ตอบ #71 เมื่อ: วันนี้ เวลา 06:03:13 PM »   
________________________________________
Chart Patterns to Avoid: Climax Top Off a Parabolic Move


This pattern occurs when a stock rises very quickly out of a base and gets overextended.

Stocks in a Parabolic Move can double or triple in value in a very short period of time (usually less than two weeks).

As an investor you certainly don't want to be one of the last passengers on the train and get quickly thrown off.

Some examples of this pattern are shown below.


Notice the quick move upward in MCOM back in July. In 5 trading days it went from $20 to $57 for a gain of 185%. Also notice that on the biggest volume day (point A) that it gapped up strongly to $53 and then closed poorly around $41. This was the Climax Top Off the Parabolic Move. As an investor you should have sold this day if you had bought the stock in the $20's. Meanwhile you certainly should have not bought this stock this day. Notice how the stock eventually pulled all the way back to $20 by early August (point B).


Another example of a Climax Top Off a Parabolic Move is demonstrated by LWIN. This stock skyrocketed from $30 to $95 in 10 trading days for a whopping gain of 217%.

The Climax Top occurred on the 10th and 11th days of trading as the volume peaked (point A). The stock then sold off and retreated back quickly to around $42 by late November.

As you can see stocks that go up very quickly, in a Parabolic Move, can also come down just as fast.


My advice is if you buy a stock and it doubles or triples in value in a very short period of time (1 to 2 weeks) take your profits and congratulate yourself for a job well done. If you become greedy then you could lose most of your gains as the above examples indicate. Furthermore if your buying a stock in this type of move be very careful and watch out for the Climax Top if the stock is trading on its biggest volume day.

« แก้ไขครั้งสุดท้าย: วันนี้ เวลา 06:06:27 PM โดย Icy »    

« แก้ไขครั้งสุดท้าย: พฤษภาคม 23, 2010, 10:02:21 PM โดย dada » บันทึกการเข้า

คนร้ายในคราบนักบุญ  น่าสะพึงกลัวกว่าสิ่งใด
Icy
Moderator
Hero Member
*****
ออฟไลน์ ออฟไลน์

กระทู้: 1188


« ตอบ #73 เมื่อ: พฤษภาคม 23, 2010, 10:12:32 PM »

The Parabolic Curve Pattern

The Parabolic Curve is probably one of the most highly prized and sought after pattern. This pattern can yield you the biggest and quickest return in the shortest possible time. Generally you will find a few of these patterns at or near the end of a major market advance. The pattern is the end result of multiple base formation breaks.


บันทึกการเข้า

ข้อเขียนทั้งหมด เป็นเพียงมุมมองส่วนตัว เพื่อแลกเปลี่ยนความคิดเห็นเท่านั้น

Icy
Moderator
Hero Member
*****
ออฟไลน์ ออฟไลน์

กระทู้: 1188


« ตอบ #74 เมื่อ: พฤษภาคม 23, 2010, 11:03:14 PM »

The Trading Rules

The trading rules by Aleksandr Yermachenko (aka ataman).

Forget the news, remember the chart. You’re not smart enough to know how news will affect price. The chart already knows the news is coming.

Buy the first pullback from a new high. Sell the first pullback from a new low. There’s always a crowd that missed the first boat.

Buy at support, sell at resistance. Everyone sees the same thing and they’re all just waiting to jump in the pool.

Short rallies not sell-offs. When markets drop, shorts finally turn a profit and get ready to cover.

Don’t buy up into a major moving average or sell down into one. See #3.


Don’t chase momentum if you can’t find the exit. Assume the market will reverse the minute you get in. If it’s a long way to the door, you’re in big trouble.

Exhaustion gaps get filled. Breakaway and continuation gaps don’t. The old traders’ wisdom is a lie. Trade in the direction of gap support whenever you can.

Trends test the point of least support/resistance. Enter here even if it hurts.

Trade with the TICK not against it. Don’t be a hero. Go with the money flow.

If you have to look, it isn’t there. Forget your college degree, trust the money flow.

Sell the second high, buy the second low. After sharp pullbacks, the first test of any high or low always runs into resistance. Look for the break on the third or fourth try.

The trend is your friend in the last hour. As volume cranks up at 3:00PM don’t expect anyone to change the channel.

Avoid buying at the open except when the Market falls before the open. They see YOU coming sucker.

1-2-3-Drop-Up. Look for downtrends to reverse after a top, two lower highs and a double bottom.

Bulls live above the 200 day, bears live below. Sellers eat up rallies below this key moving average line and buyers come to the rescue above it.

Price has memory. What did price do the last time it hit a certain level? Chances are it will do it again.

Big volumes kill moves. Climax blow-offs take both buyers and sellers out of the market and lead to sideways action.

Trends never turn on a dime. Reversals build slowly. The first sharp dip always finds buyers and the first sharp rise always finds sellers.

Bottoms take longer to form than tops. Greed acts more quickly than fear and causes stocks to drop from their own weight.

Beat the crowd in and out the door. You have to take their money before they take yours, period.


บันทึกการเข้า

ข้อเขียนทั้งหมด เป็นเพียงมุมมองส่วนตัว เพื่อแลกเปลี่ยนความคิดเห็นเท่านั้น

Gold Price today, Gold Trend Price Prediction, ราคาทองคํา, วิเคราะห์ทิศทางทองคํา
   

images by free.in.th
Thanks: ฝากรูป dictionary ---------------------Charts courtesy of Moore Research Center, Inc. For more information on Moore Research products and services click here. --- http://www.mrci.com ---------- ---------------------------------------------รูปกราฟแสดงราคาทองในอดีตปี 1974-1999 ของ Moore Research Center, Inc. แสดงฤดูกาลที่ราคาทองขึ้นสูงสุดและตําสุด เอาแบบคร่าวๆ เส้นนําตาลหรือนําเงินก็ใกล้เคียงกัน เส้นนําตาลเฉลี่ย 15 ปี เส้นนําเงินเฉลี่ย 26 ปี ราคาตําสุดของเส้นนําตาล หรือเฉลี่ย 15 ปี ในเดือน ปลายเดือน เมษ และปลายเดือน สค ต่อต้นเดือน กย[/color] สูงสุดในเดือน กพ กับ พย / ส่วนเฉลี่ย 26 ปี ราคาตําสุด ต้น กค กับ ปลาย สค และราคาสูงสุดในเดือน กพ และ กลางเดือน ตค ----- แค่ดูคร่าวๆ เป็นแนวทาง อย่ายึดมั่นว่าจะต้องเป็นตามนี้ ข้างล่างเป็นกราฟราคานํามัน ตามฤดูกาล จาก Charts courtesy of Moore Research Center, Inc. images by free.in.th
Thanks: ฝากรูป dictionary
 บันทึกการเข้า
หน้า: 1 ... 3 4 [5] 6   ขึ้นบน
พิมพ์
กระโดดไป: